
Why Some Regulators Publish Public Complaint Statistics
The Nevada Gaming Control Board publishes complaint statistics. The UKGC publishes complaint data. These agencies are not trying to help players. They are creating accountability.
The Transparency Impulse
A regulator publishes data showing that Casino A received fifty complaints last year and Casino B received five. Players see this and conclude Casino B is safer. This is true, but it is not why the regulator published the data.
Regulators publish complaint data for internal political reasons. They need to justify their existence and their budget. A regulator can say: "We received 12,000 player complaints, investigated 11,500, and recovered 8 million dollars in disputed funds." This narrative shows efficacy.
The public benefit is secondary. But it is real. Players who see complaint data can make informed choices. Casinos that receive many complaints face reputation damage. The regulator's transparency creates market pressure.
What the Numbers Actually Show
A casino with five complaints might be better than one with fifty. Or it might be smaller, with fewer players, generating fewer complaints simply by volume. A casino that processes ten thousand deposits per year will naturally have more disputes than a casino that processes one thousand deposits per year.
Regulators usually adjust for this. They publish both raw numbers and complaint rates (complaints per thousand transactions, or per thousand players, depending on the metric). This allows for comparison across casinos of different sizes.
What the numbers do not show is complaint severity. Ten minor billing disputes count the same as one case of money being stolen. A regulator's data might note this (breaking out complaint categories), or it might lump everything together. The presentation shapes what players conclude.
The Gaming Control Board Model
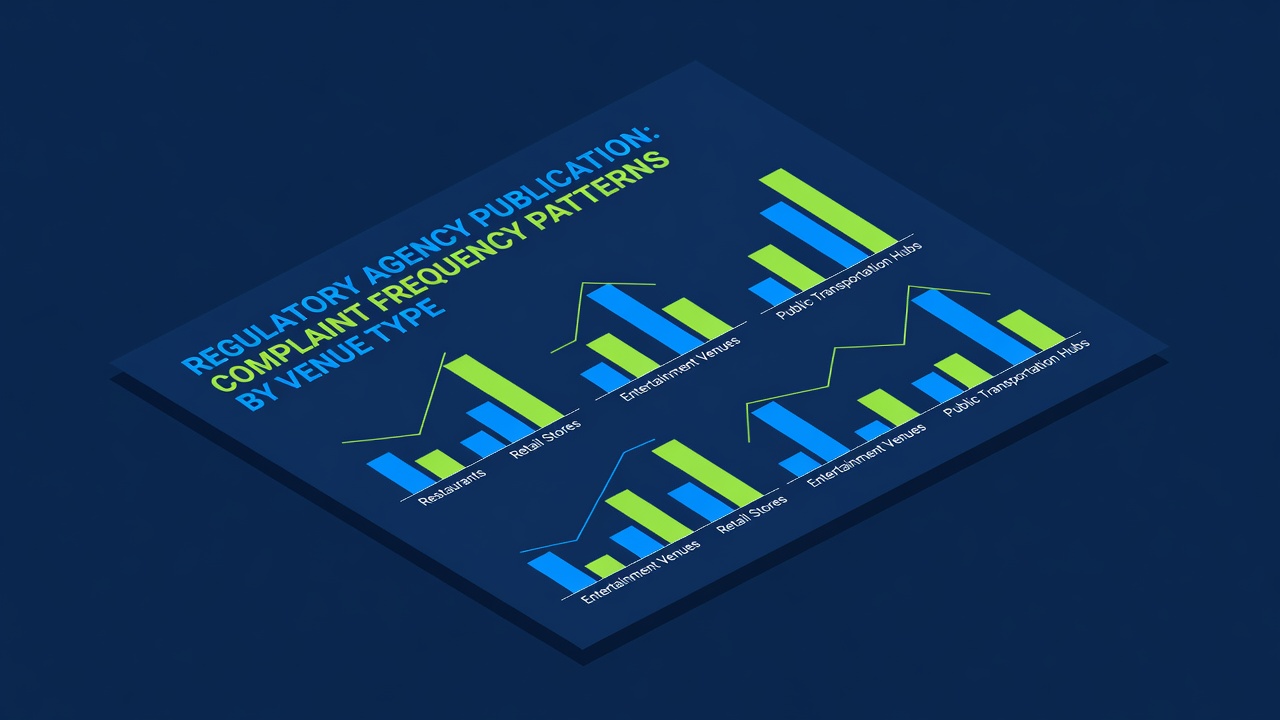
Nevada's Gaming Control Board publishes quarterly complaint data. Their format: "During Q1 2024, the board received 847 complaints about licensed casinos. Complaints were categorized as follows: billing disputes (412), payout disputes (284), and other (151). The average resolution time was 45 days. 76% of complaints were resolved in the player's favor or with settlement."
This data is useful. It shows the volume, the types of problems, and the resolution rate. A player can see that payout disputes (where the casino is accused of not paying out a win) are a real category. The player can check if a specific casino appears frequently in payout complaints.
The data does not show which casinos were complained about most. That would require merging complaint data with casino licensing data. Some regulators do this. Some do not, citing privacy concerns.
The UKGC Approach
The UK Gambling Commission publishes enforcement action data. They list which operators they have fined, when, and for what violations. This is more direct than complaint data. It shows actual regulatory action, not just complaints.
The UKGC publishes this to create a transparency archive. It deters violations. An operator knows that if they commit a compliance breach, it will be publicly recorded. This is powerful incentive structure.
Malta (the MGA) publishes license revocation data. When a casino loses its license, the reason is usually published. This creates narrative around which violations lead to license loss. Players can see that money laundering results in license loss, that rigged games result in license loss, that refusing player payouts results in license loss.
The Asymmetry
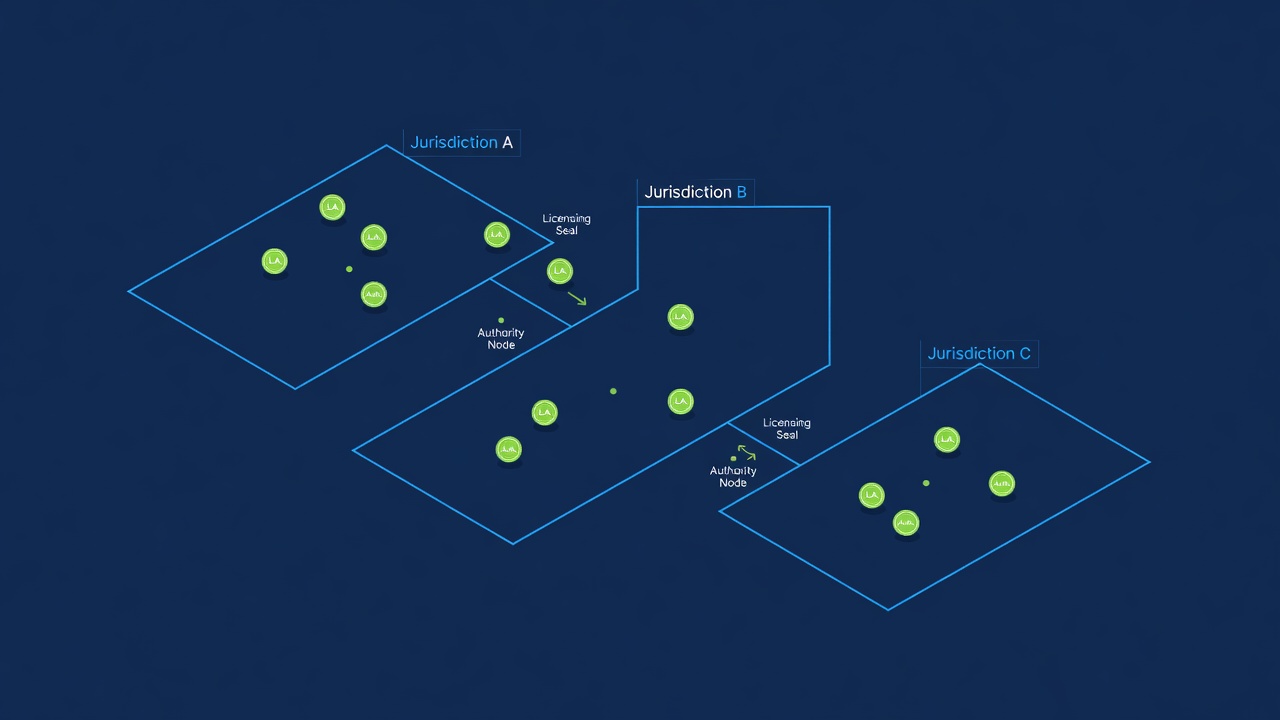
Not all regulators publish complaint data. Some treat complaints as confidential. Others publish aggregate data but not operator-specific breakdowns. The variation in transparency creates an information asymmetry.
A player cannot necessarily compare operators across different jurisdictions because the data is not in the same format. Nevada publishes complaint numbers. The UK publishes enforcement actions. Canada publishes compliance audit results. Comparing these requires understanding the underlying processes, which is beyond most players' capacity.
This is likely intentional. Regulators do not want to make it easy for players to compare jurisdictions. If players could easily see that Nevada casinos have higher complaint rates than UKGC casinos, the competitive pressure would force Nevada casinos to improve or go out of business.
The Signaling Function
Complaint data functions as a signal. A casino with zero published complaints is not necessarily better than a casino with ten complaints. But a casino with two hundred complaints is probably worse than both.
Smart casinos monitor this data closely. They invest in customer service to reduce complaints. They settle disputes quickly to avoid escalation to the regulator. They know that complaint data is part of their brand image.
The regulator publishing this data is not a gift to players. It is a mechanism of accountability. But the side effect is that players who know how to read the data can use it to make better choices. This is worth understanding.
Rooms for this read
Share this read