

How to Build a Sports Betting Model From Scratch
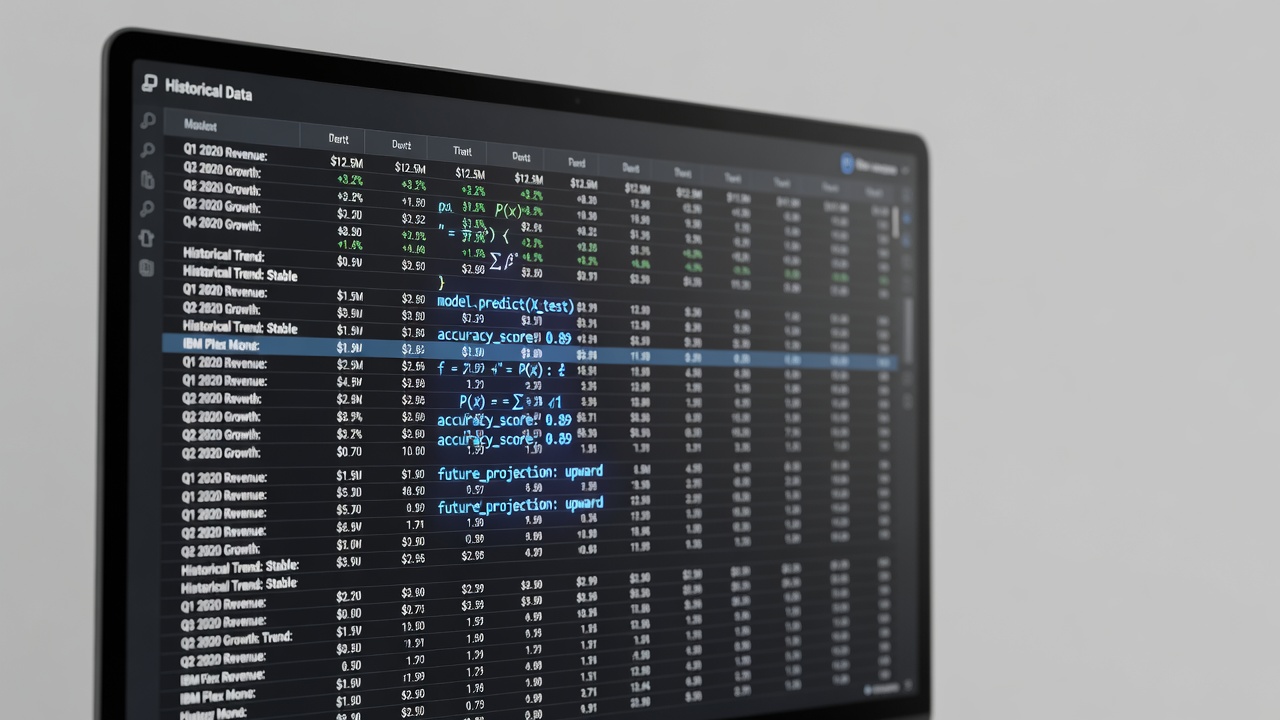
A basic sports betting model starts with historical data, team statistics, and adjustment factors. The model does not need to be perfect. It just needs to find spots where the market is mispriced.
The Foundation: Data and Historical Performance
I spent twenty-three years in surveillance. I watched every angle of the floor from the sky. I saw players manipulate dealers. I saw dealers manipulate machines. But the most interesting work happens before anyone hits the tables: building models that find edge.
A sports betting model starts simple. You take five years of NFL game data. Win-loss records. Point differentials. Home field advantage. Injury reports by date. Offensive yards per game. Defensive yards per game allowed. This is not proprietary information. It is all public.
You feed this data into a spreadsheet or, if you want to be professional about it, a programming language like Python. You build a formula that takes input (Team A at home vs Team B with injuries) and outputs a probability (Team A wins 57% of the time). That formula is your model.
The Adjustment Factors
Raw statistics lie. They hide information. If Team A has averaged 28 points per game this season but scored 42 against the worst defense in the league and 14 against the best, the average is worthless.
You need to build adjustments. Strength of schedule. Quality of opponent faced. Travel fatigue. Days of rest. Coaching changes. Weather conditions for outdoor sports. These are the factors that change how much weight you give to historical statistics.
A simple model might say: "Team A's scoring average is 24 points per game, Team B's defense allows 20 points per game, therefore Team A will score 22 points." A real model says: "Team A scores 24 points on average. Against teams ranked in the top 10 defensively, they score 19. Team B is ranked 8th. Team A is missing its starting wide receiver, which historically reduces scoring by 2 points. Therefore Team A will score approximately 17 points, plus or minus 2." The adjustment takes you from guessing to reasoning.
Building the Test
Once you have a model, you do not immediately start betting. You backtest. You run the model on historical data where you already know the outcome. You pretend it is last season. Your model predicts Team A beats Team B by 3 points. The real result was Team A won by 5. Your model was wrong, but directionally right.
You do this for every game of five seasons. You measure how often your model predicted the winner correctly. You measure the average error margin. You calculate how many times your model disagreed with the betting line and whether you would have made money by following those disagreements.
Backtesting reveals problems fast. If your model says "passing games are inherently more valuable," but historical data shows they win at the same rate as running-focused teams, your model has a bias. You remove it or adjust it.
The Moneyline vs. Spread Problem
A model that predicts who wins is not the same as a model that predicts whether the spread will hit. The two are related but different.
If your model says Team A has a 57% chance to win, that is useful. But the sportsbook has already priced in Team A having approximately a 52% chance (if the line is Team A minus 3, since -3 typically implies the favorite at about 60% probability after accounting for vig, but that math is complex). The spread exists to balance action, not just to price true probability.
You need a separate model for the spread. This model says: "Given that the spread is 3 points, and given our estimate that Team A is 57% to win, and given that our model is right 58% of the time, is there value in taking Team A?" The answer requires knowing your model's accuracy (how often it is right) and confidence (how sure is it in this particular prediction).
The Financial Model
Knowing where value exists is different from knowing how to bet it. If your model finds that Team A plus 5 is underpriced (the true line should be plus 3.5), you want to bet it. But how much?
You use something called the Kelly Criterion, or a variant. The formula is: bet size as a percentage of bankroll equals (edge) divided by (odds). If Team A at plus 5 gives you a 2% edge over the sportsbook's fair line, and the odds are approximately even money, then you bet 2% of your bankroll. If your edge is 5%, you bet 5%.
Betting more than your edge justifies is how bettors go broke. Betting less means you never capture the full value of an advantage. Getting the bet sizing right is where models fail in practice.
The Tracking
Once you start betting, you track ruthlessly. Every wager. The line when you bet. The line at kickoff. The result. Your model's prediction vs. the actual outcome. Over fifty bets, luck noise dominates. Over five hundred bets, you see the true quality of your model.
If you are profitable, keep going and slowly increase bet size. If you are break-even or negative, go back to the model. Find the error. Recalibrate. Do not keep betting hoping it turns around.
The Hard Truth
Most models lose money. The sportsbooks employ sharp bettors and advanced modelers. They move lines by half a point based on early action from smart money. By the time a retail bettor finds an edge and acts on it, the line has often moved to eliminate the edge.
The only way to consistently beat the line is to have an informational advantage (you know something the market does not yet) or a methodological advantage (your model is legitimately better). Most retail bettors have neither.
But if you build a model carefully, test it honestly, and bet it disciplined, you at least have a chance. That is better than guessing.
Rooms for this read
Share this read